Japan is a country of contrasts—densely packed urban megacities alongside vast, sparsely populated rural regions. With around 330 people per square kilometer, Japan’s average population density is high by global standards, but the distribution is far from even.
🌍 How Japan Compares Globally
Country
Population Density (people/km?)
Notes
Monaco
~26,000
Highest in the world (city-state)
Singapore
~8,000
Urbanized and compact
South Korea
~520
Highly urbanized
Japan
~330
Mountainous, concentrated cities
United Kingdom
~280
Dense in urban areas
China
~150
Wide regional variations
United States
~36
Large landmass, low average
Canada
~4
Vast and mostly unpopulated
Japan has an average population density of roughly 330 people per km².
This is much higher than countries like the United States (around 36/km²) and Canada (around 4/km²), which have vast, underpopulated territories.
Japan is denser than most European nations, such as the UK (~280/km²).
However, it is less dense than compact city-states like Singapore (~8,000/km²) and Monaco (~26,000/km²).
Japan’s terrain plays a big role—roughly 70% of the land is mountainous, meaning most of the population is squeezed into limited flat, habitable areas.
🏙️ Japan’s Most Densely Populated Prefectures (Top 5)
Rank
Prefecture
Population Density (people/km3)
Notable Feature
1
Tokyo
~6,400
Capital city, global urban hub
2
Osaka
~4,600
Business and cultural center
3
Kanagawa
~3,800
Yokohama and dense suburbs
4
Saitama
~1,950
Residential, Tokyo commuter belt
5
Aichi
~1,480
Nagoya, industrial and urban mix
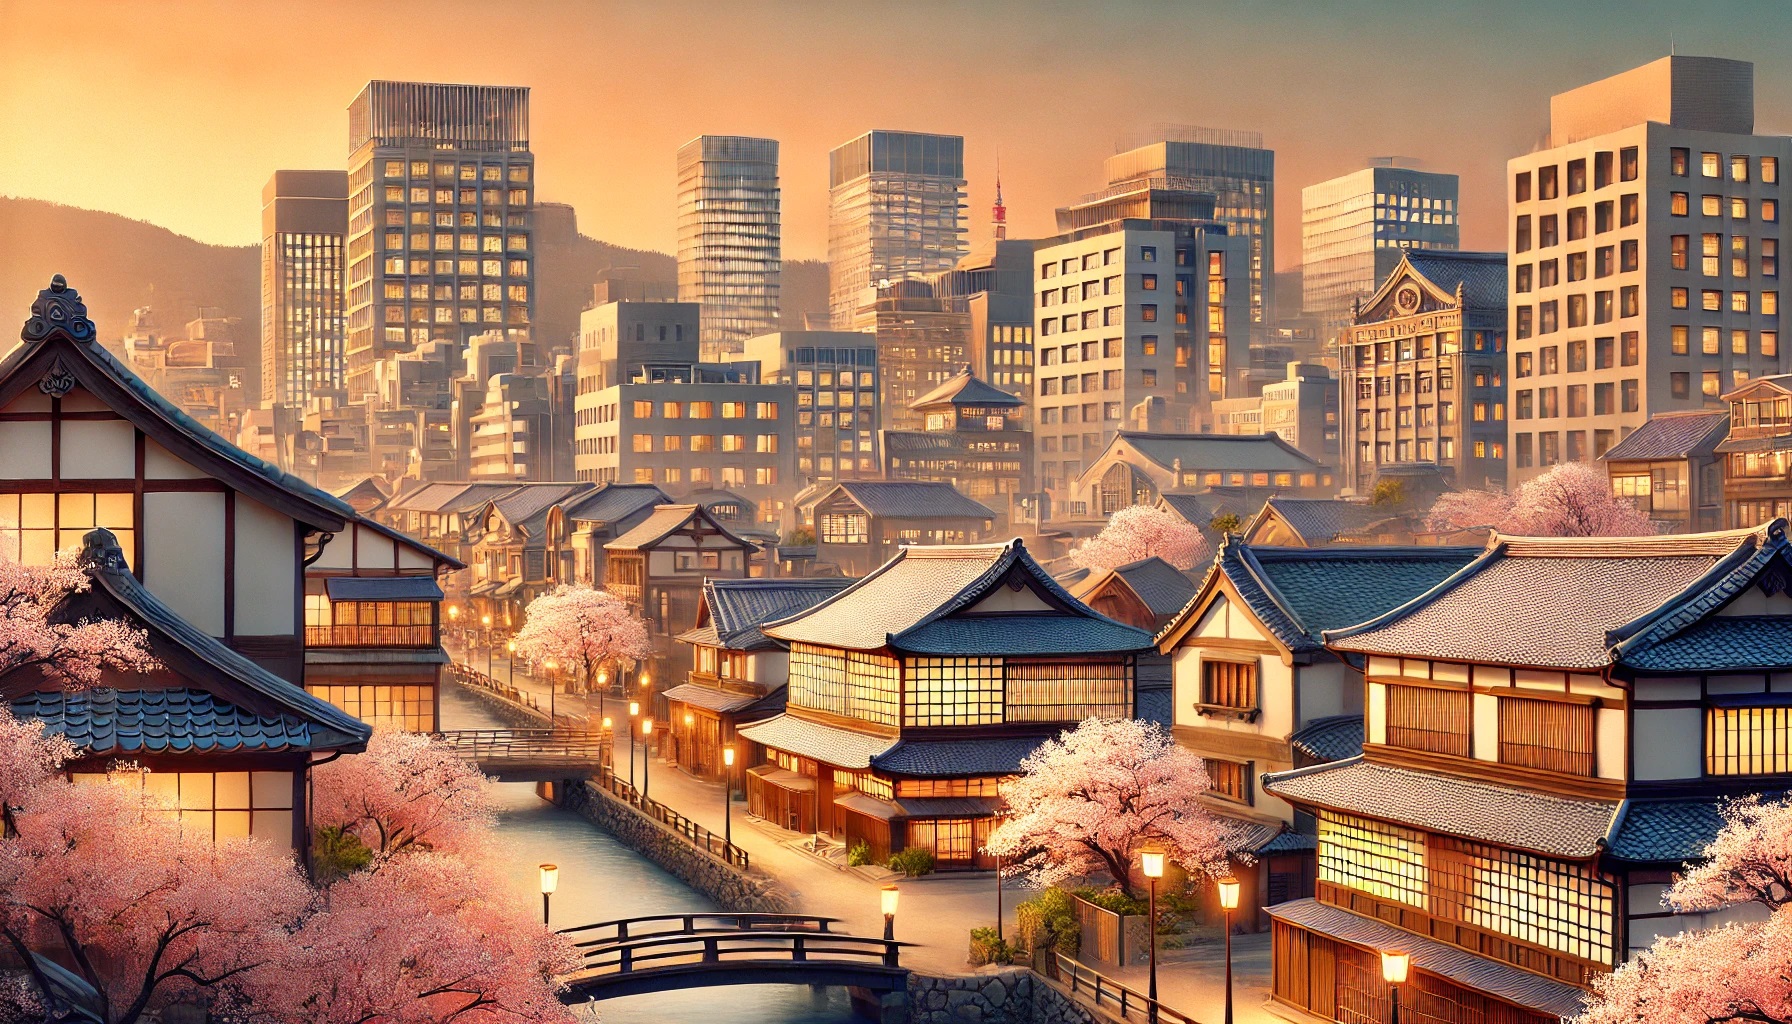
1. Tokyo
The most densely populated region in Japan.
Over 6,000 people live in each square kilometer.
It's the political, cultural, and economic center of the country, with massive urban infrastructure.
2. Osaka
Japan’s second-largest urban center.
Known for its dense business districts and residential neighborhoods.
Home to a rich blend of history and modern development.
3. Kanagawa
Includes large cities like Yokohama and Kawasaki.
Popular with commuters working in Tokyo.
One of the most urbanized prefectures after Tokyo.
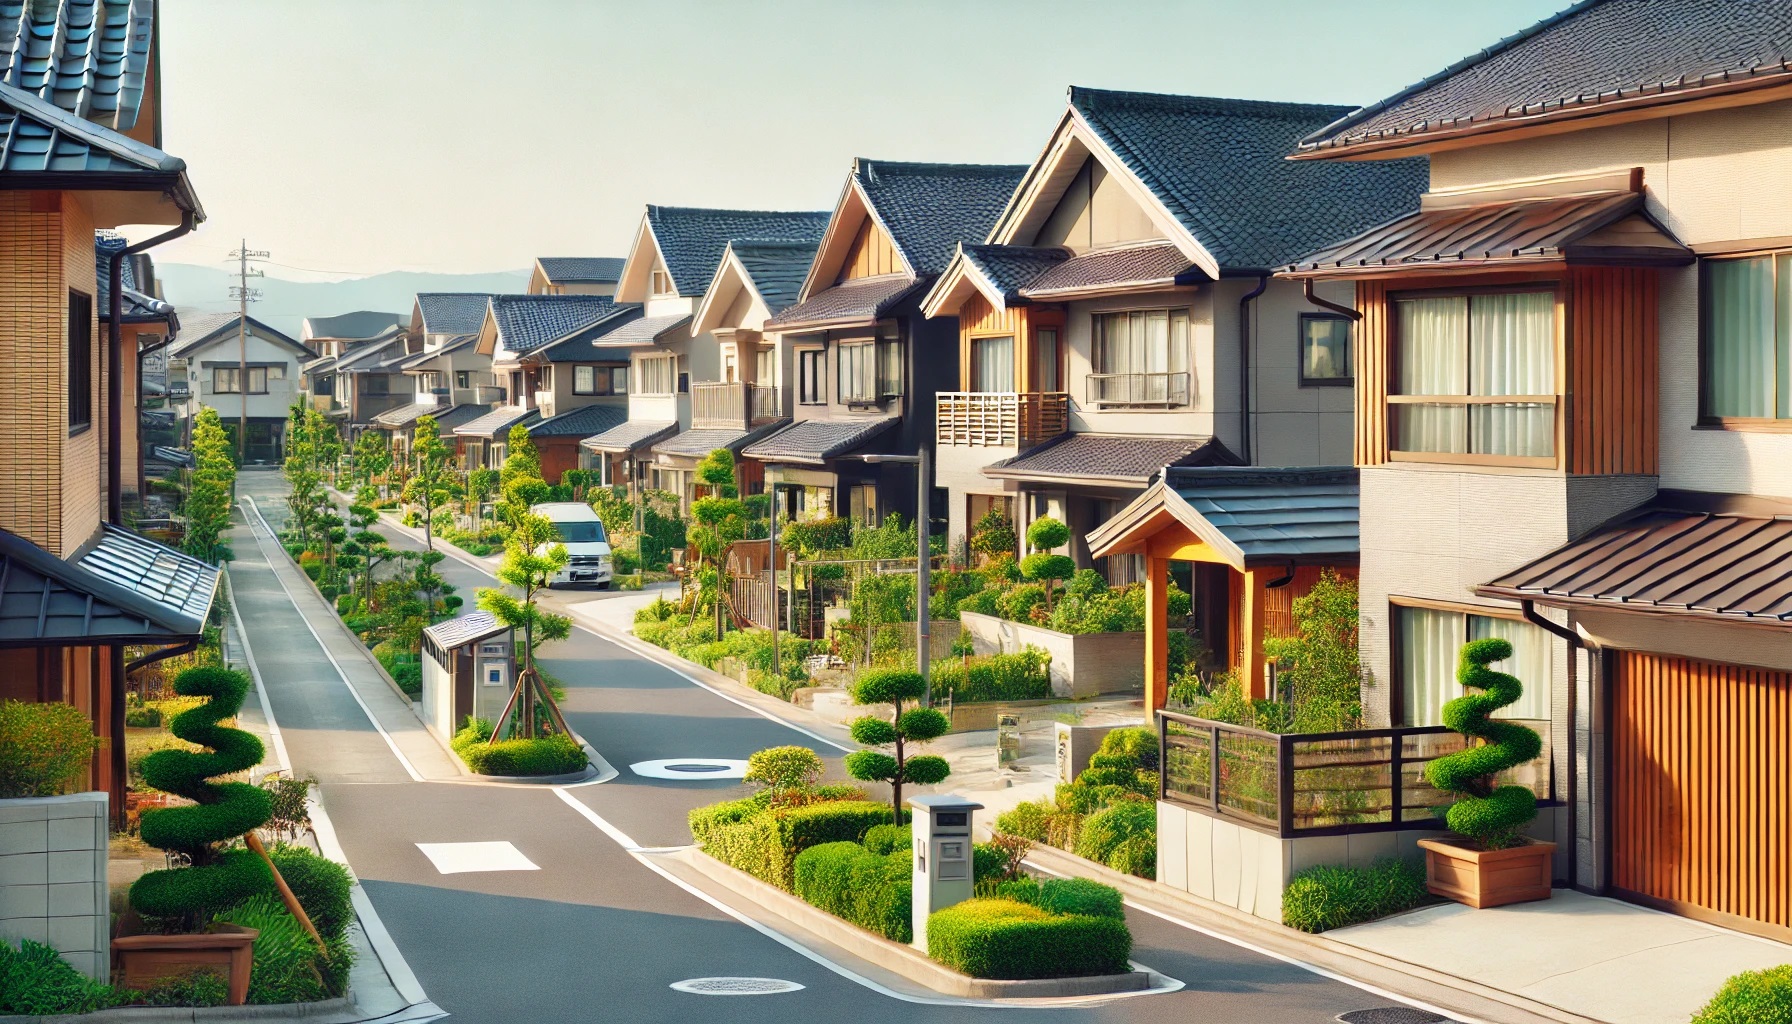
4. Saitama
Primarily a residential area for Tokyo workers.
High population density in suburbs and along train lines.
Continues to grow due to affordable housing and accessibility.
5. Aichi
Centered around Nagoya, a major industrial hub.
Combines urban population with a strong manufacturing economy.
Known for being the heart of Japan’s automotive industry.
🌲 Japan’s Least Densely Populated Prefectures (Bottom 5)
Rank
Prefecture
Population Density (people/km3)
Notable Feature
1
Hokkaido
~64
Vast land, low population
2
Iwate
~79
Mountainous, sparsely settled
3
Akita
~82
Rural, aging population
4
Shimane
~96
Isolated, historical landmarks
5
Kochi
~97
Shikoku coast, limited flatland
1. Hokkaido
Japan’s northernmost and largest prefecture.
Despite its size, it has a low population spread across large rural areas.
Known for natural beauty, forests, and harsh winters.
2. Iwate
Located in the Tōhoku region in northeastern Japan.
Mostly mountainous with limited urban development.
Traditional communities and agricultural land dominate.
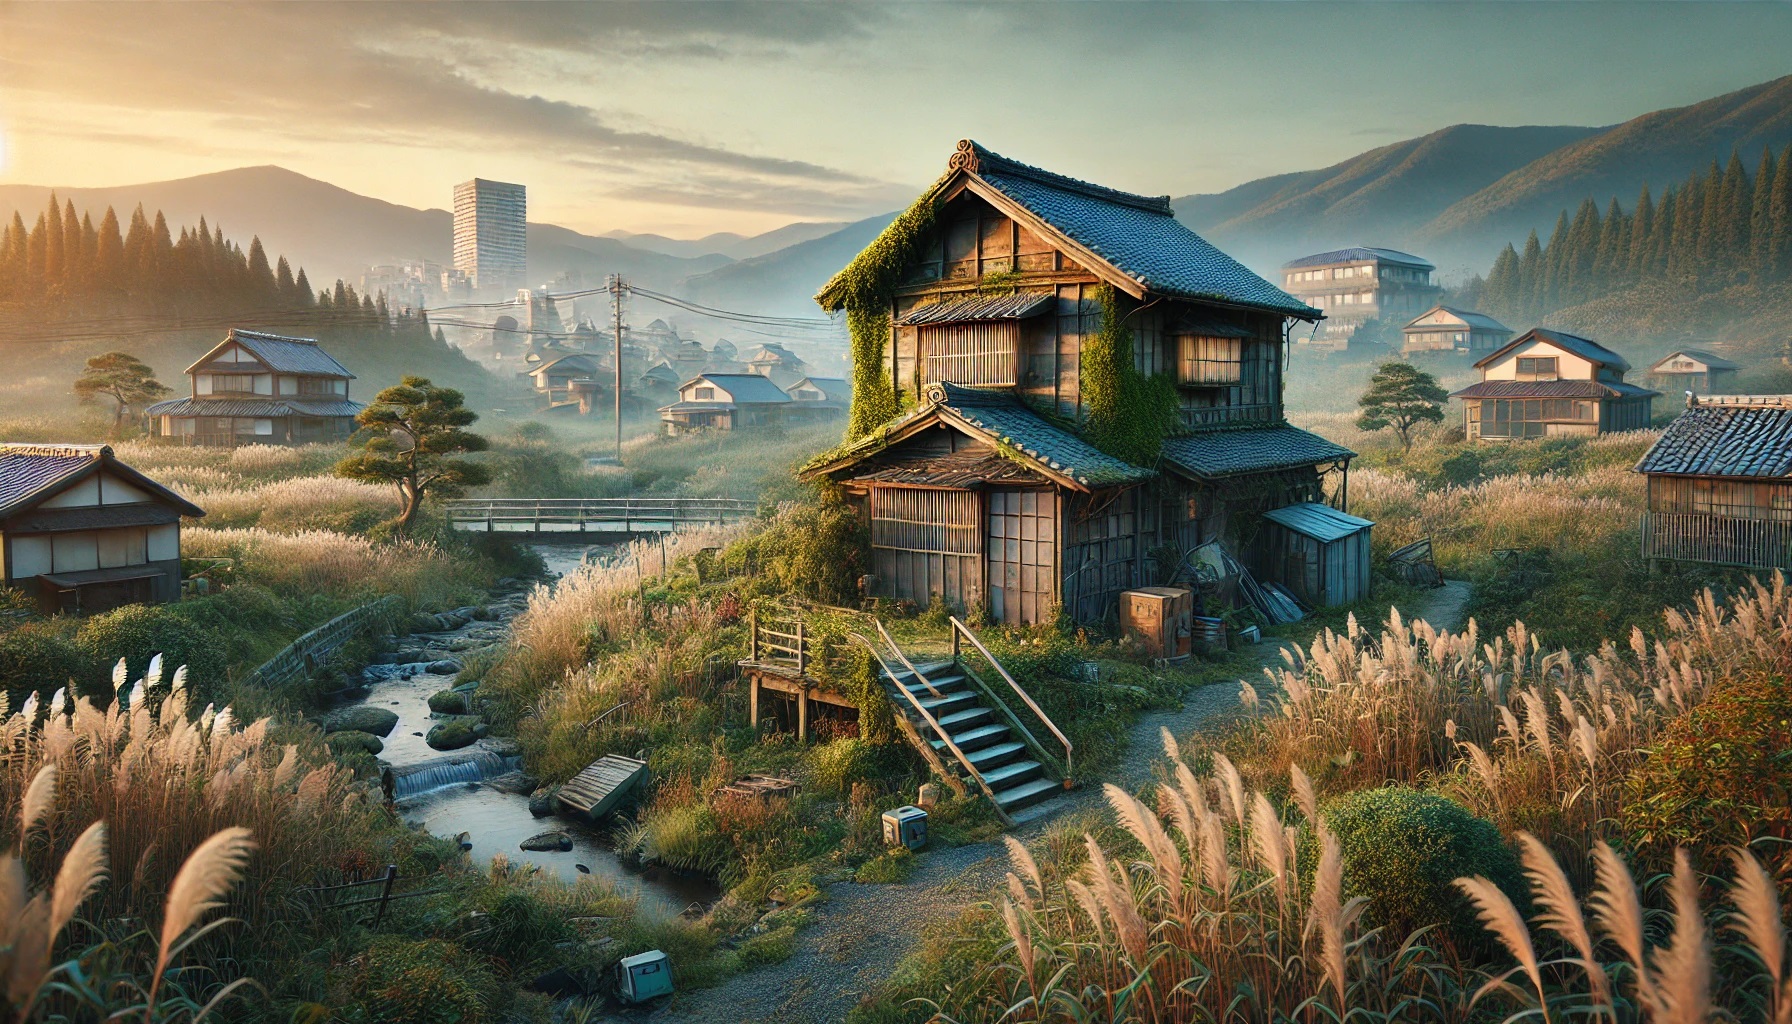
3. Akita
Facing rapid depopulation and aging.
Limited economic activity and remote location contribute to its low density.
Known for rice farming and cultural festivals.
4. Shimane
One of Japan’s most secluded prefectures.
Low birth rates and limited industry have slowed growth.
Rich in cultural heritage but challenged by migration to cities.
5. Kōchi
Located on the island of Shikoku.
Mountainous terrain and isolated communities lead to sparse settlement.
Maintains strong local traditions and scenic coastlines.
🧭 Final Thoughts
Japan’s population density reflects not just how many people live there, but where they live. Cities like Tokyo and Osaka are among the most crowded places in the world, while regions like Hokkaido and Shimane struggle with depopulation and aging residents. These stark contrasts shape Japan’s infrastructure, economy, and long-term planning.